Population ecology links ecology to population genetics and evolution.
In nature, we rarely find isolated, single individuals of any species; majority of them live in groups in a well defined geographical area, share or compete for similar resources, potentially interbreed and thus constitute a population..
Although an individual organism is the one that has to cope with a changed environment, it is at the population level that natural selection operates to evolve the desired traits.
Population Attributes
Population Attributes
Various characteristics
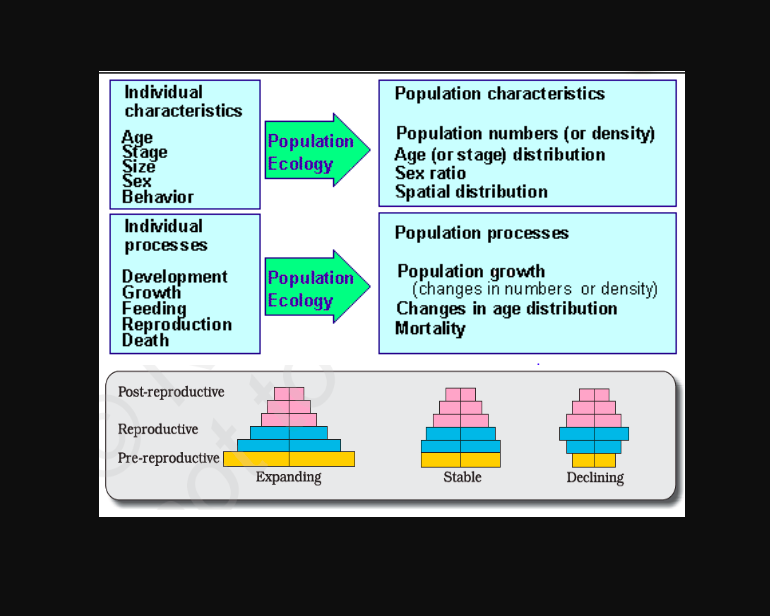
A population has certain attributes whereas, an individual organism does not. An individual may have births and deaths, but a population has birth rates and death rates. In a population these rates refer to per capita births and deaths. The rates, hence, expressed are change in numbers (increase or decrease) with respect to members of the population..
- Example: If in a pond there were 20 lotus plants last year and through reproduction 8 new plants are added, taking the current population to 28, we calculate the birth rate as 8/20 = 0.4 offspring per lotus per year.
sex ratio and Age Pyramid
An individual is either a male or a female but a population has a sex ratio (e.g., 60 per cent of the population are females and 40 per cent males). A population at any given time is composed of individuals of different ages. If the age distribution (per cent individuals of a given age or age group) is plotted for the population, the resulting structure is called an age pyramid.
- For human population:The age pyramids generally show age distribution of males and females in a diagram. The shape of the pyramids reflects the growth status of the population - (a) whether it is growing, (b) stable or (c) declining.
Cont...

Population Size and Density
Within a particular habitat, a population can be characterized by its population size (N), the total number of individuals, and its population density, the number of individuals within a specific area or volume.
population density (designated as N),
need not necessarily be measured in numbers only. Although total number is generally the most appropriate measure of population density, it is in some cases either meaningless or difficult to determine.

To understand the enormous role of the Banyan Tree
the per cent cover or biomass is a more meaningful measure of the population size..
- 1.:Total number is again not an easily adoptable measure if the population is huge and counting is impossible or very time-consuming.
- 2.: Sometimes, for certain ecological investigations, there is no need to know the absolute population densities; relative densities serve the purpose equally well.
Cont...

- 3.: the number of fish caught per trap is good enough measure of its total population density in the lake.
- 4.: We are mostly obliged to estimate population sizes indirectly, without actually counting them or seeing them. The tiger census in our national parks and tiger reserves is often based on pug marks and fecal pellets
Cont...
Population Size
for any species is not a static parameter.
-
Cause of Change ..
Density of a population in a given habitat during a given period, fluctuates due to changes in four basic processes, Natality Mortality Immigration Emigration -
Increase and Decrease
two of which contribute to an increase in population density Natality and Immigration and two of which contribute to to a decrease in population density Mortality and Emigration
NCERT EXCERPT
N is the population density at time t, then its density at time t +1 is
Nt+1 = Nt + [(B + I) – (D + E)]
Population density will increase if the number of births plus the number of
immigrants (B + I) is more than the number of deaths plus the number
of emigrants (D + E).
Under normal conditions, births and deaths are
the most important factors influencing population density, the other
two factors assuming importance only under special conditions. For
instance, if a new habitat is just being colonised, immigration may
contribute more significantly to population growth than birth rates.
Growth Models
Types-
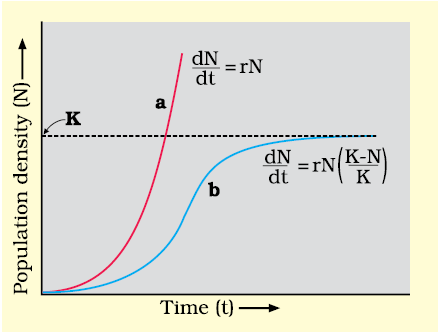
Exponential growth::
Resources in the habitat are unlimited, each species has the ability to realise fully its innate potential to grow in number, as Darwin observed while developing his theory of natural selection. Then the population grows in an exponential or geometric fashion.
Rate of Population Change:
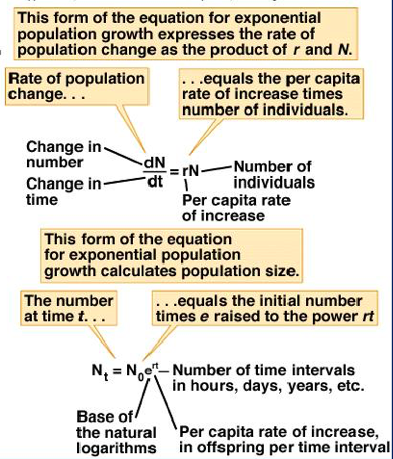
If in a population of size N, the birth rates (not total number but per capita births) are represented as b and death rates (again, per capita death rates) as d, then the increase or decrease in N during a unit time period t (dN/dt) will be
- So..
- dN/dt = rN
The r in this equation is called the ‘intrinsic rate of natural increase’ and is a very important parameter chosen for assessing impacts of any biotic or abiotic factor on population growth.
Rate of Population Change:
To give you some idea about the magnitude of r values, for the Norway rat the r is 0.015, and for the flour beetle it is 0.12. In 1981, the r value for human population in India was 0.0205.
- So..
- Find out what the current r value of India ?
In 2020, rate of natural increase for India was 10.14 persons per thousand population.(10.14/1000).i.e Rate of natural increase of India fell gradually from 22.09 persons per thousand population (22.09/1000) in 1971 to 10.14 persons per thousand population (10.14/1000) in 2020.
Exponential
or geometric growth pattern of a population results in a J-shaped curve when we plot N in relation to time.
Nt = N0ert
Nt= Population density after time t
N0= Population density at time zero
r = intrinsic rate of natural increase
e = the base of natural logarithms (2.71828)
Logistic growth:
Any species growing exponentially under unlimited
resource conditions can reach enormous population
densities in a short time. Darwin showed how even
a slow growing animal like elephant could reach
enormous numbers in the absence of checks.
No population of any species in nature has at its
disposal unlimited resources to permit exponential growth. This
leads to competition between individuals for limited resources.
Eventually, the ‘fittest’ individual will survive and reproduce.
Logistic Growth
In nature, a given habitat has enough resources to support a maximum possible number, beyond which no further growth is possible. Let us call this limit as nature’s carrying capacity (K) for that species in that habitat.
A population growing in a habitat with limited resources show initially a lag phase, followed by phases of acceleration and deceleration and finally an asymptote, when the population density reaches the carrying capacity
The realistic one
A plot of N in relation to time (t) results in a sigmoid curve. This type of population growth is called Verhulst-Pearl Logistic Growth and is described by the following equation: (In Diagram)
Where N = Population density at time t
N0= Population density at time zero
r = intrinsic rate of natural increase
K = Carrying capacity
Since resources for growth for most animal populations are finite and become limiting sooner or later, the logistic growth model is considered a more realistic one.
Life History Variation
Populations evolve to maximise their reproductive fitness, also called Darwinian fitness (high r value), in the habitat in which they live. Under a particular set of selection pressures, organisms evolve towards the most efficient reproductive strategy.
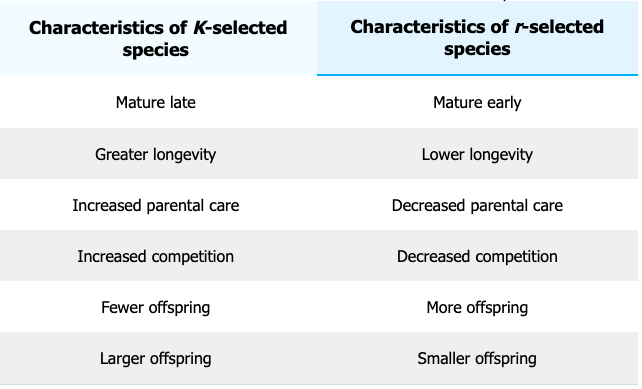
K-selected versus r-selected species.
Some organisms breed only once in their lifetime (Pacific salmon fish, bamboo) while others breed many times during their lifetime (most birds and mammals). Some produce a large number of small-sized offspring (Oysters, pelagic fishes) while others produce a small number of large-sized offspring (birds, mammals).
K-versus-r: which is desirable for maximising fitness?
Life History Variation
Ecologists suggest that life history traits of organisms have evolved in relation to the constraints imposed by the abiotic and biotic components of the habitat in which they live.
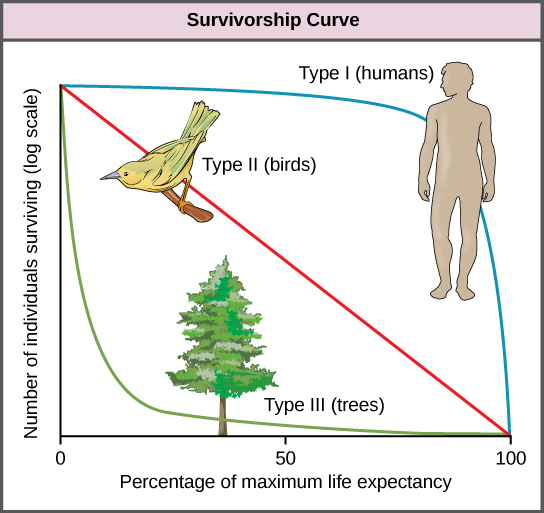
Survivorship Curves
Definition:
Survivorship curves show the chance of survival in a population according to age. The number of individuals surviving (on a log scale) is on the y-axis, and time (representing relative age) is on the x-axis.
Survivorship curve
is a graph of the number of individuals surviving at each age interval versus time.
- Type I: Survivorship curve, mortality is low in the early and middle years and occurs mostly in older individuals. Organisms exhibiting a type I survivorship typically produce few offspring and provide good care to the offspring increasing the likelihood of their survival. Humans and most mammals exhibit a type I survivorship curve.
Cont...
Survivorship curve
is a graph of the number of individuals surviving at each age interval versus time.
- Type II: Survivorship curves, mortality is relatively constant throughout the entire life span, and mortality is equally likely to occur at any point in the life span. Many bird populations provide examples of an intermediate or type II survivorship curve.
Cont...
Survivorship curve
is a graph of the number of individuals surviving at each age interval versus time.
- Type III: Survivorship curves, early ages experience the highest mortality with much lower mortality rates for organisms that make it to advanced years. Type III organisms typically produce large numbers of offspring, but provide very little or no care for them.
Trees and marine invertebrates exhibit a type III survivorship curve because very few of these organisms survive their younger years, but those that do make it to an old age are more likely to survive for a relatively long period of time.
While is no exact association between reproductive strategies (K- or r-selected) and survivorship curves (Type I, II, or III), K-selected species are more likely to have a Type III survivorship curve. r-selected species tend to have a Type I survivorship curve.
Ready to read Next ?
Read Ecology Part -3 on Community Ecology.